Office of Institutional Research and Assessment (OIRA)
Oglala Lakota College’s Office of Institutional Research and Assessment (OIRA) promotes a culture of evidence and data-driven decisions: The OIRA collects, analyzes, and reports institution-level data, oversees the institutional effectiveness process, guides and monitors units’ assessment of student learning, and provides unit-level data to college centers and departments. The OIRA also takes the lead in reporting institutional data internally and externally, including required reporting to the Integrated Postsecondary Education Data System, the Higher Learning Commission, the Bureau of Indian Education, and the American Indian Higher Education Consortium.
Fall-to-Fall Retention
Fall 2023 to Fall 2024 Retention by Class and Enrollment Status
OLC monitors fall-to-fall retention of degree-seeking students by class and enrollment status (full-time vs. part-time). Using retention of full-time juniors from Fall 2023 to Fall 2024 as an example, retention is calculated as follows: (# of Fall 2023 full-time juniors who return in Fall 2024 [44] + # of full-time juniors who graduated during 2023-24 [11]) ÷ (# of juniors enrolled full-time in Fall 2023 [73] - # Exclusions (e.g., deaths) [0]) * 100 = 75%. In general, full-time students are retained at a higher rate than students with part-time enrollment.
| Class Code | Full-Time Students | Part-Time Students | All Students | ||||||||||||
|---|---|---|---|---|---|---|---|---|---|---|---|---|---|---|---|
| Fa 23 | Fa 24 Return | 23-24 Grad. | Exclusions | Retention Rate | Fa 23 | Fa 24 Return | 23-24 Grad. | Exclusions | Retention Rate | Fa 23 | Fa 24 Return | 23-24 Grad. | Exclusions | Retention Rate | |
| Entering Freshmen | 61 | 39 | 0 | 0 | 64% | 55 | 28 | 0 | 0 | 51% | 116 | 67 | 0 | 0 | 58% |
| Freshmen | 164 | 104 | 0 | 0 | 63% | 200 | 81 | 1 | 0 | 41% | 364 | 185 | 1 | 0 | 51% |
| Sophomores | 122 | 75 | 16 | 1 | 75% | 122 | 55 | 7 | 0 | 51% | 244 | 130 | 23 | 1 | 63% |
| Juniors | 73 | 44 | 11 | 0 | 75% | 98 | 45 | 12 | 0 | 58% | 171 | 89 | 23 | 0 | 65% |
| Seniors | 90 | 45 | 31 | 0 | 83% | 153 | 66 | 28 | 0 | 61% | 243 | 110 | 59 | 0 | 70% |
| Total Degree-Seeking UG | 510 | 306 | 58 | 1 | 72% | 628 | 275 | 48 | 0 | 51% | 1138 | 581 | 106 | 1 | 60% |
Fall-to-Fall Retention of Full-Time Entering Freshmen
For external reporting, retention of full-time entering freshmen, particularly those pursuing a Bachelor’s degree, is most relevant. OLC was able to increase retention of full-time entering freshmen pursuing a bachelor’s degree from 40% (Fall 2013 to Fall 2014) to 62% (Fall 2023 to Fall 2024).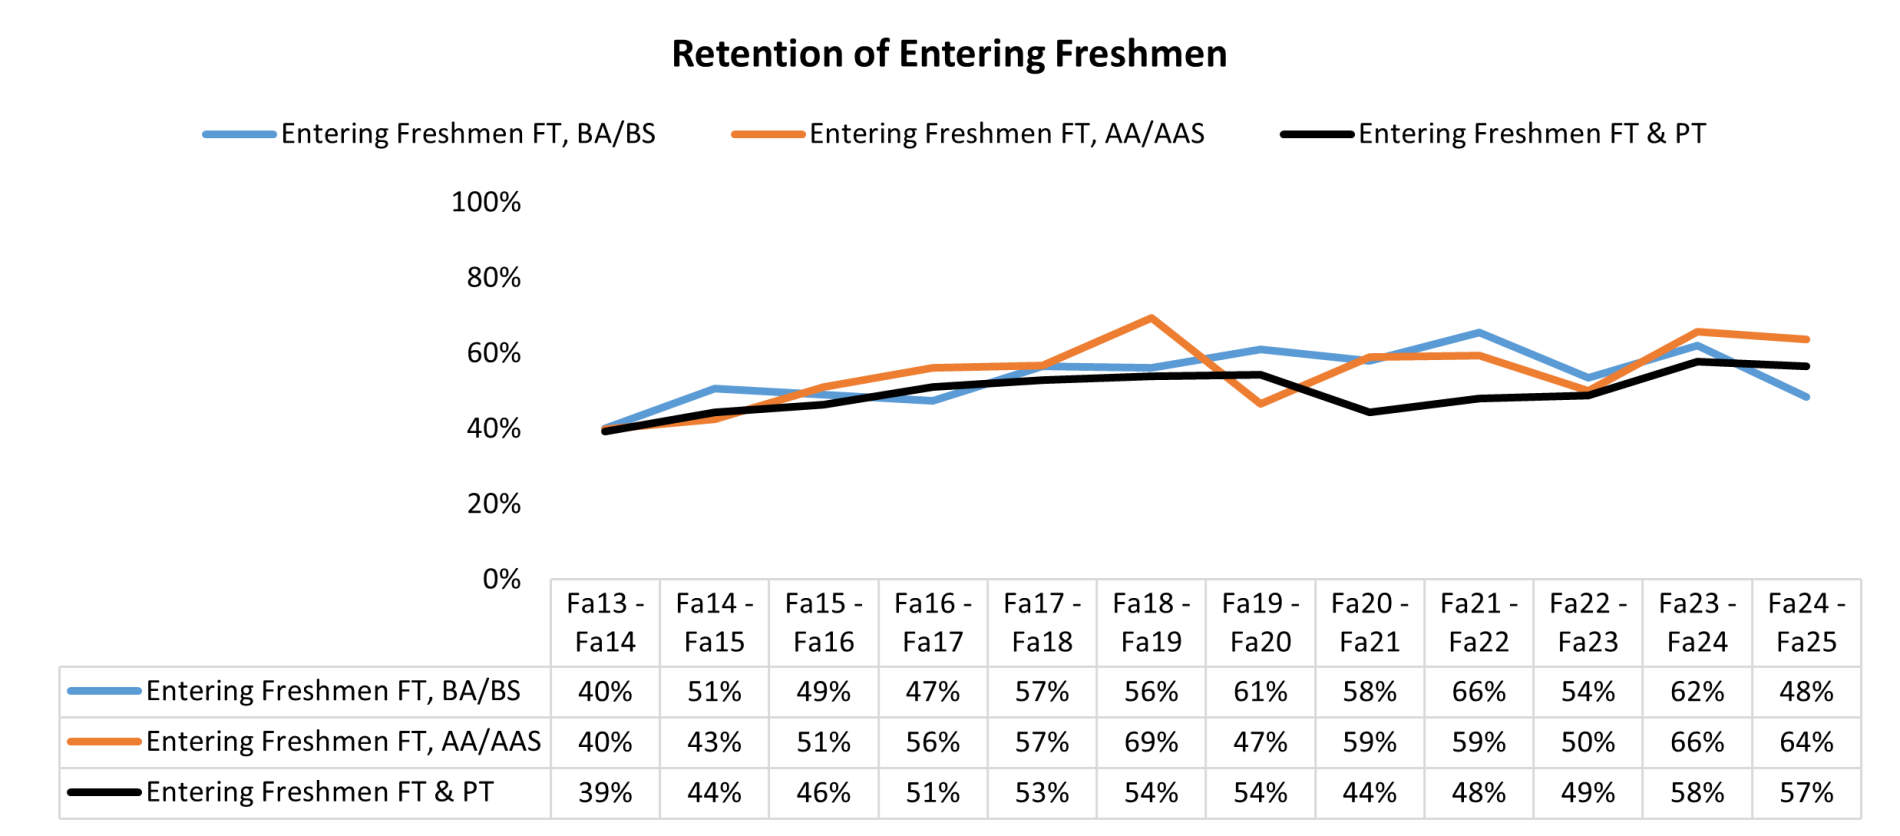
Semester-to-Semester Persistence
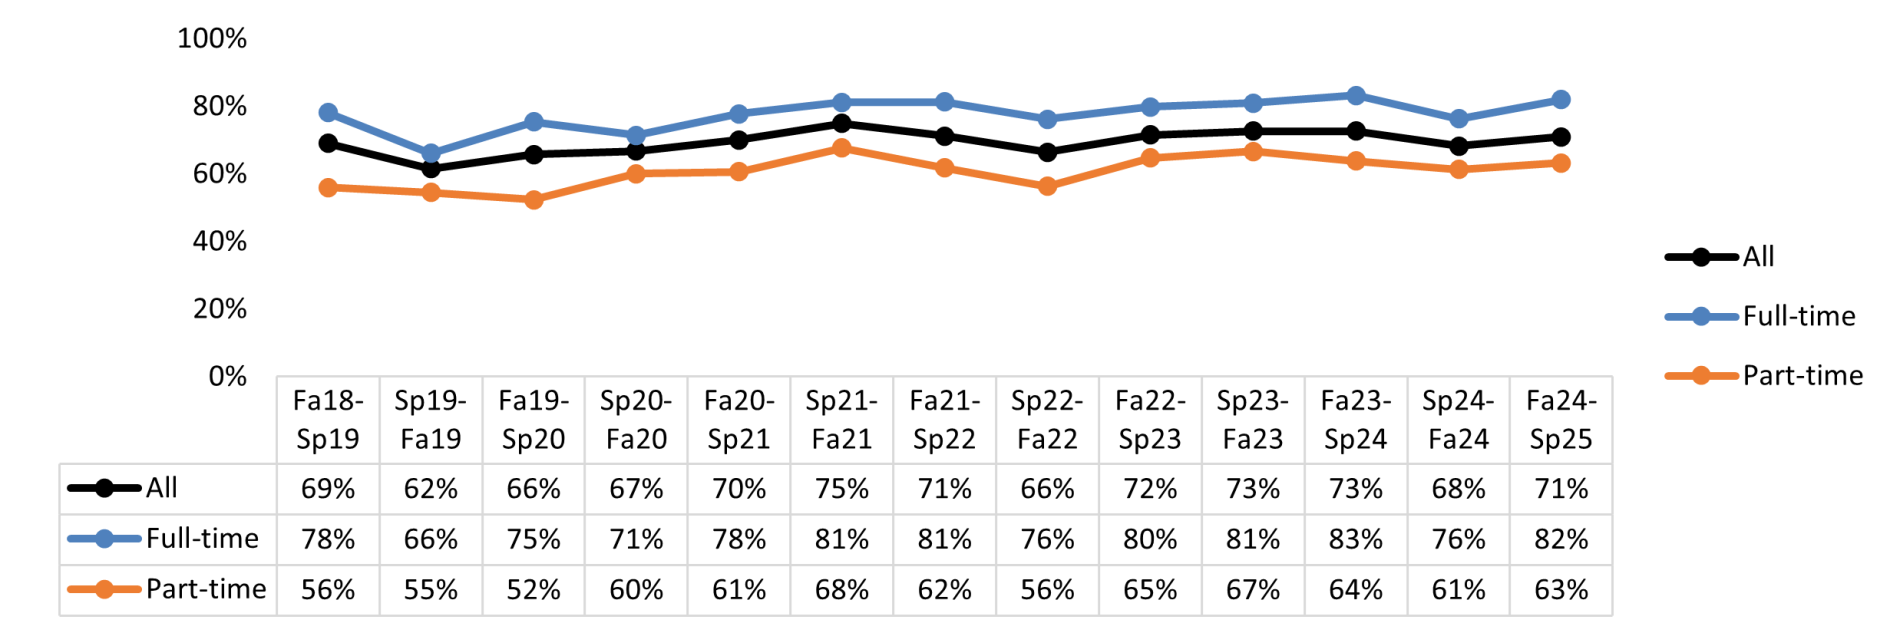
Persistence of Full-Time and Part-Time Degree-Seeking Students
OLC also tracks re-enrollment from semester to semester (persistence). Generally, persistence has increased slightly, with full-time students persisting at a higher rate than part-time students.
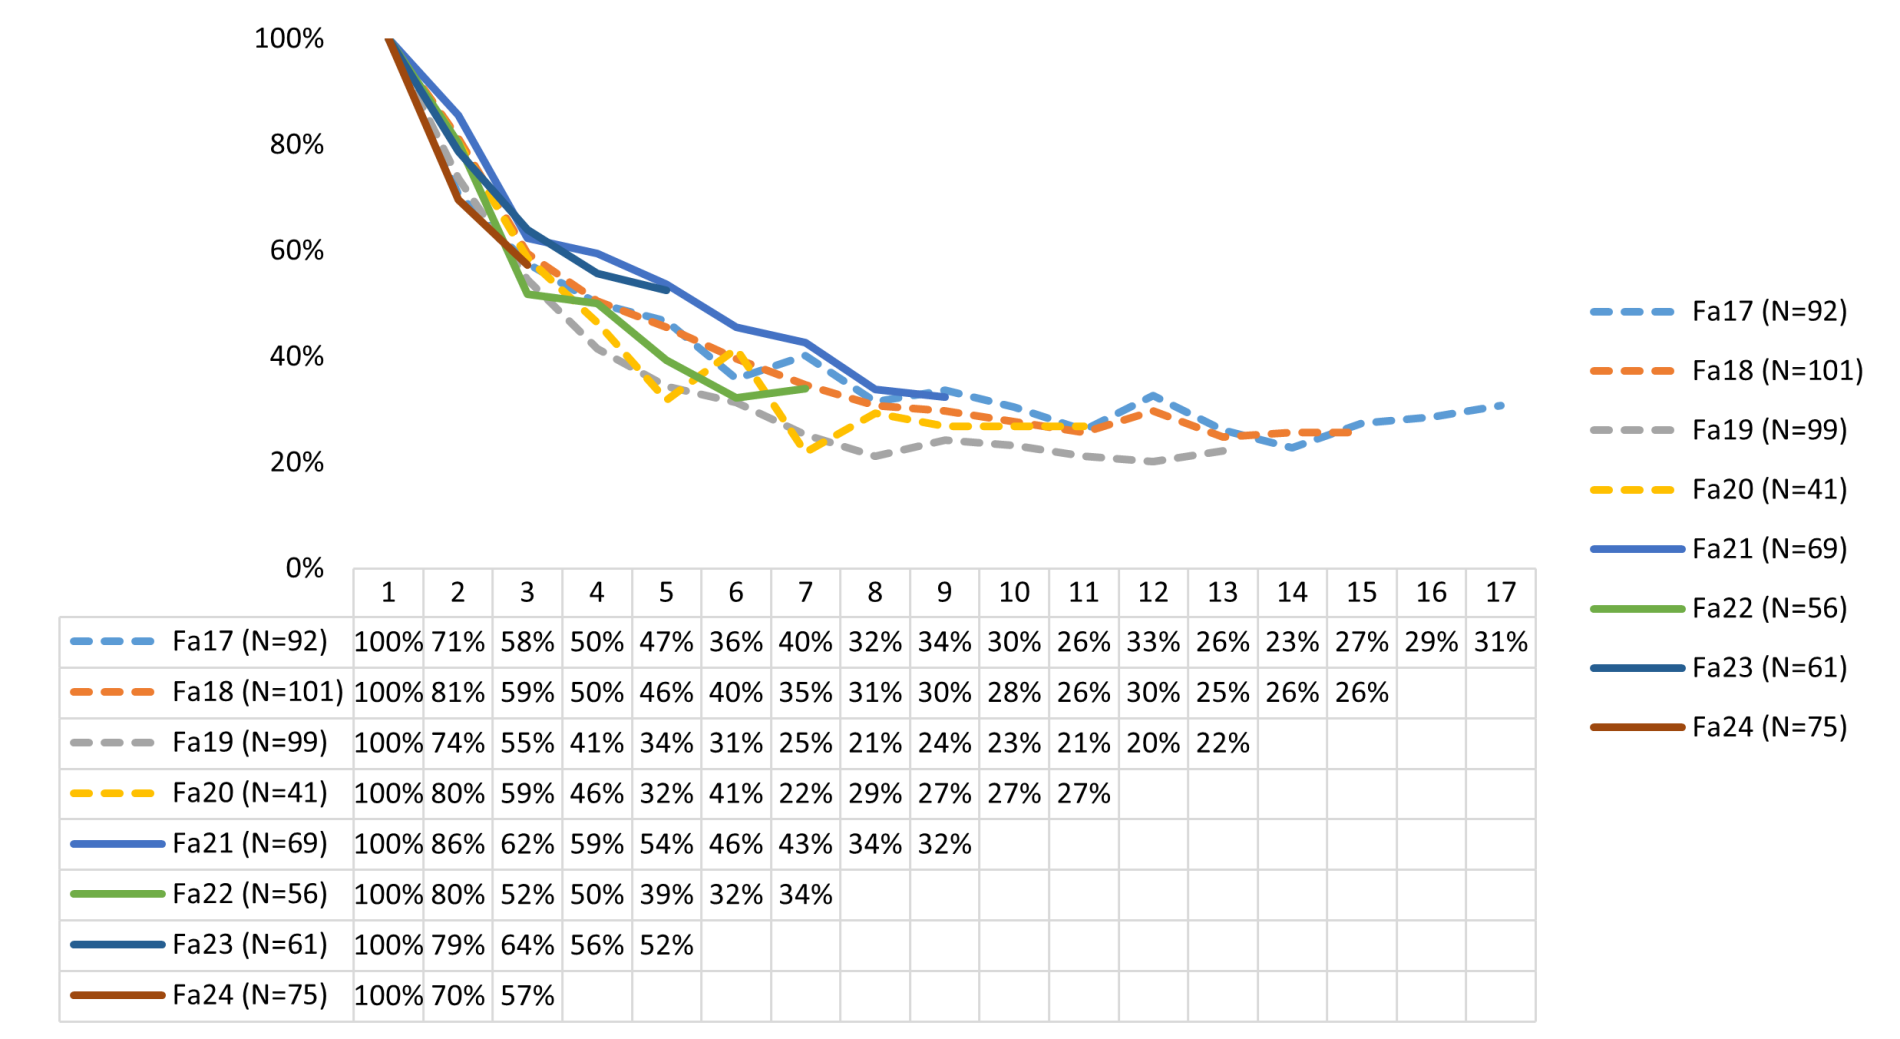
Cohort Persistence of Fall Full-Time Entering Freshmen
Additionally, OLC uses a cohort-based approach to look at what happens to students who start at the same time term after term. The chart below shows the Fall 2017 to Fall 2024 full-time entering freshmen cohorts and the percentage who were still enrolled or who graduated in the subsequent semesters.
Completion
Completion Rates
OLC tracks cohorts of Entering Freshmen to determine how many students graduate from a cohort in 4-,6-, and 8-year increments. This data is reported to a national database called IPEDS (Integrated Postsecondary Education Data System). It is important to keep in mind that the IPEDS completion rates are only looking at students who entered OLC without prior college experience and registered full-time in their first semester. In order to graduate with a Bachelor’s within 4 years, students would need to take 15 credits per semester, which generally less than 10% of the degree-seeking students do.
| Fall Full-Time BA/BS-degree-seeking Cohort | 100% - 4yrs | 150% - 6yrs | 200% - 8yrs | ||||
|---|---|---|---|---|---|---|---|
| # | % | # | % | # | % | ||
| 2010 | 58 | 0 | 0% | 5 | 9% | 7 | 12% |
| 2011 | 87 | 0 | 0% | 2 | 2% | 4 | 5% |
| 2012 | 95 | 0 | 0% | 6 | 6% | 8 | 8% |
| 2013 | 70 | 1 | 1% | 4 | 6% | 5 | 7% |
| 2014 | 64 | 0 | 0% | 2 | 3% | 3 | 5% |
| 2015 | 63 (-1 exclusion) | 0 | 0% | 4 | 6% | 5 | 8% |
| 2016 | 49 | 0 | 0% | 2 | 4% | 5 | 10% |
| 2017 | 52 (-1 exclusion) | 0 | 0% | 2 | 4% | 5 | 10% |
| 2018 | 62 | 0 | 0% | 6 | 10% | - | - |
| 2019 | 54 | 0 | 0% | 5 | 9% | - | - |
| 2020 | 19 | 0 | 0% | - | - | - | - |
| 2021 | 32 (-1 exclusion) | 0 | 0% | - | - | - | - |
The associate-degree equivalents to graduating with a bachelor’s in 4 (100%), 6 (150%), or 8 year (200%) are 2, 3, and 4 years.
| Fall Full-Time AA/AAS-Degree-Seeking Cohort | 100% – 2 Years | 150% – 3 Years | 200% – 4 Years | ||||
|---|---|---|---|---|---|---|---|
| # | % | # | % | # | % | ||
| 2011 | 85 | 1 | 1% | 2 | 2% | 3 | 4% |
| 2012 | 74 | 0 | 0% | 3 | 4% | 3 | 4% |
| 2013 | 103 | 0 | 0% | 1 | 1% | 6 | 6% |
| 2014 | 43 | 0 | 0% | 3 | 7% | 5 | 12% |
| 2015 | 47 | 0 | 0% | 3 | 7% | 6 | 13% |
| 2016 | 32 | 1 | 3% | 4 | 13% | 5 | 16% |
| 2017 | 40 | 0 | 0% | 8 | 20% | 12 | 30% |
| 2018 | 39 | 0 | 0% | 0 | 0% | 3 | 8% |
| 2019 | 45 | 0 | 0% | 0 | 0% | 1 | 2% |
| 2020 | 22 | 0 | 0% | 2 | 9% | 3 | 14% |
| 2021 | 37 | 0 | 0% | 5 | 14% | - | - |
| 2022 | 28 | 0 | 0% | 2 | 7% | - | - |
| 2023 | 32 | 0 | 0% | - | - | - | - |
2024–25 Awarded Degrees
In June 2025, OLC awarded 149 credentials to 142 students.
| Department | CERT | AA | AAS | AS | BA | BS | MA | TOTAL |
|---|---|---|---|---|---|---|---|---|
| Business | - | 25 | - | - | - | 7 | - | 32 |
| Education | - | 11 | - | - | 5 | 1 | - | 17 |
| Graduate Studies | - | - | - | - | - | - | 10 | 10 |
| Humanities and Social Science | - | 1 | - | - | - | - | - | 1 |
| Lakota Studies | 11 | 18 | - | - | 14 | - | - | 43 |
| Math, Science and Technology | - | 4 | 3 | 2 | - | 13 | - | 22 |
| Nursing | - | 8 | - | - | - | - | - | 8 |
| Social Work | - | - | - | - | - | 8 | - | 8 |
| Vocational Education | - | - | 8 | - | - | - | - | 8 |
| TOTAL | 11 | 67 | 11 | 2 | 19 | 29 | 10 | 149 |
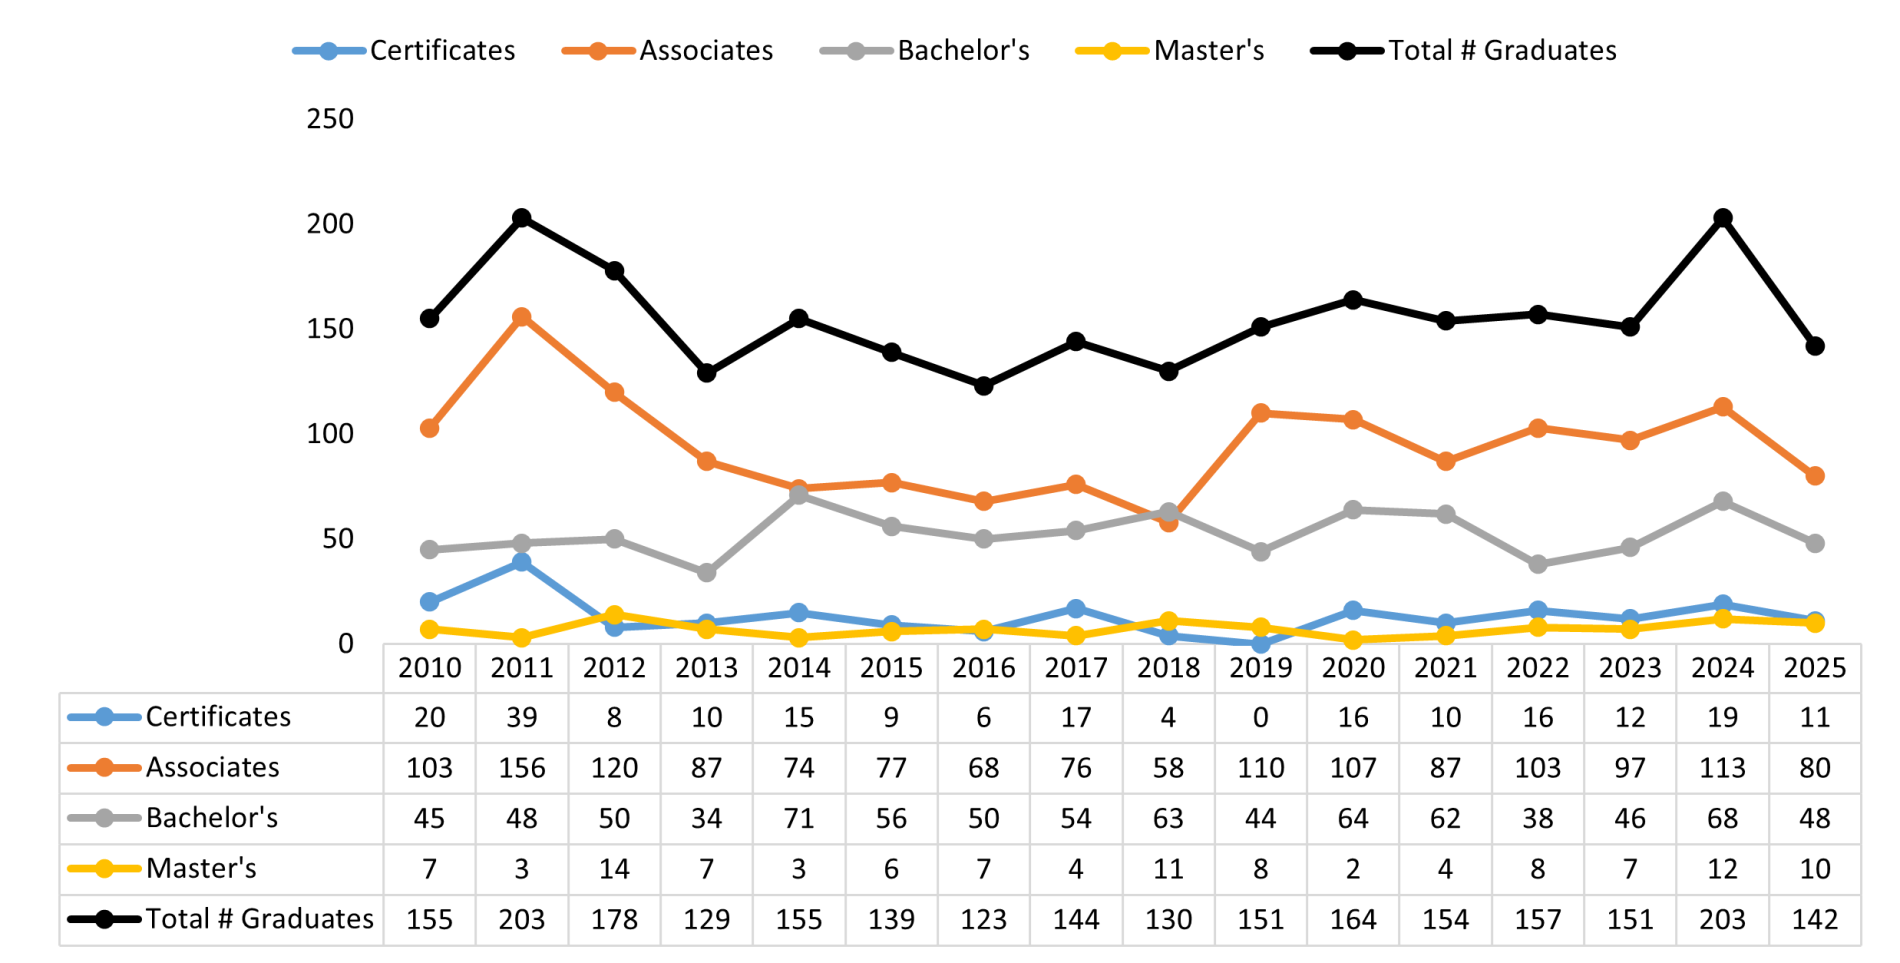
Awards by Degree Level: 2010-2025
The number of degrees awarded per year has fluctuates partly because of changes to degree offerings: In 2012, the number of associate programs was consolidated to encourage students to work toward a bachelor’s instead of accumulating multiple AAs. Before this change has gone into effect, students were encouraged to complete their AAs, resulting in a peak in AA/AAS awards, followed by an increase in bachelor’s degrees. In 2019, the number of AAs awarded increased once again due to the reintroduction of two AA programs. In 2024, 203 students graduated with a credential, the largest graduating class tied with 2011.
Success of OLC Graduates
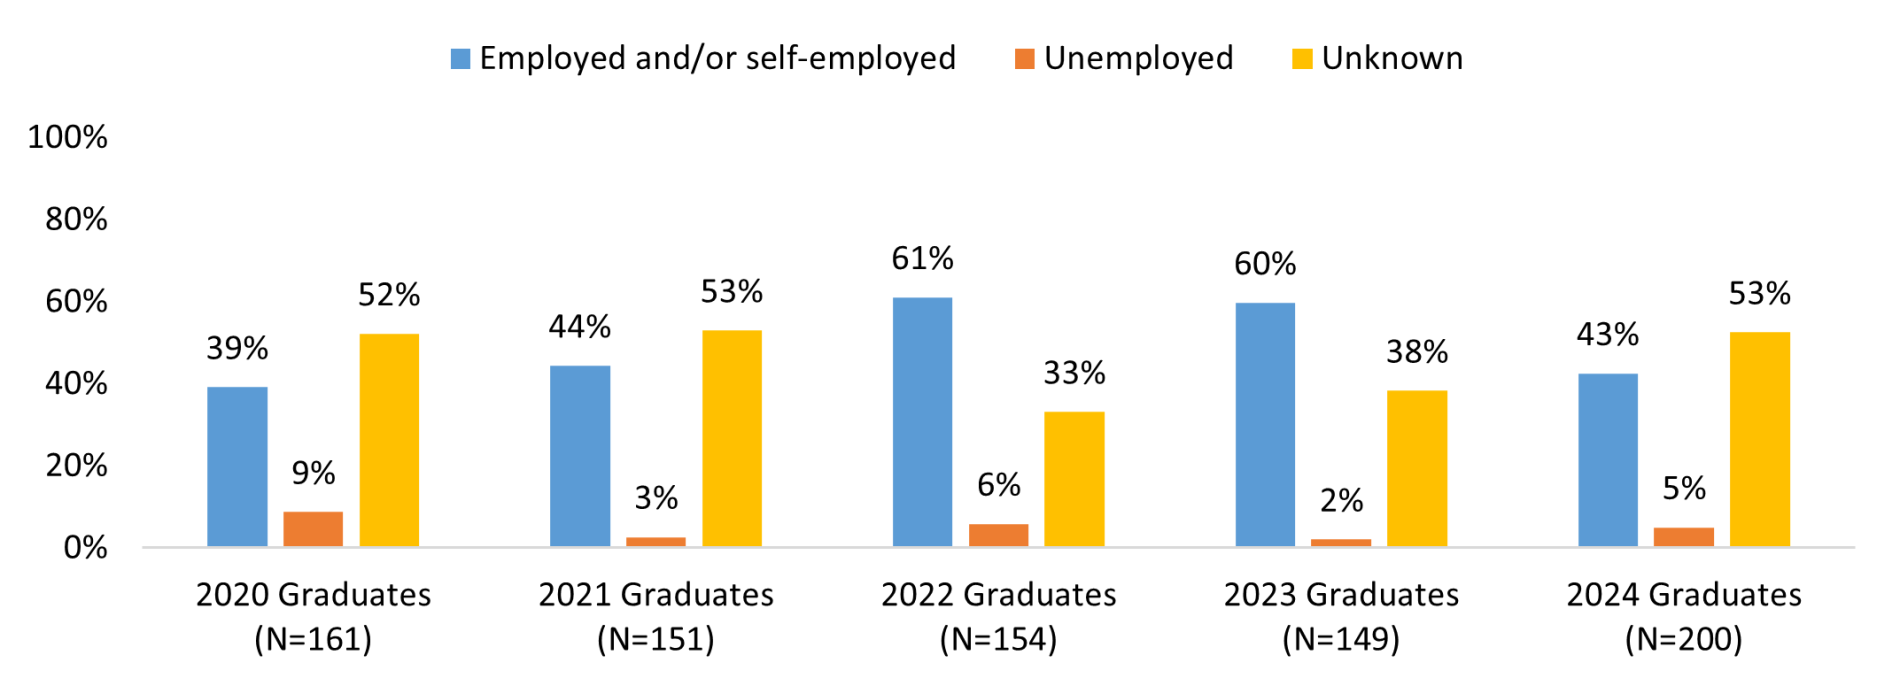
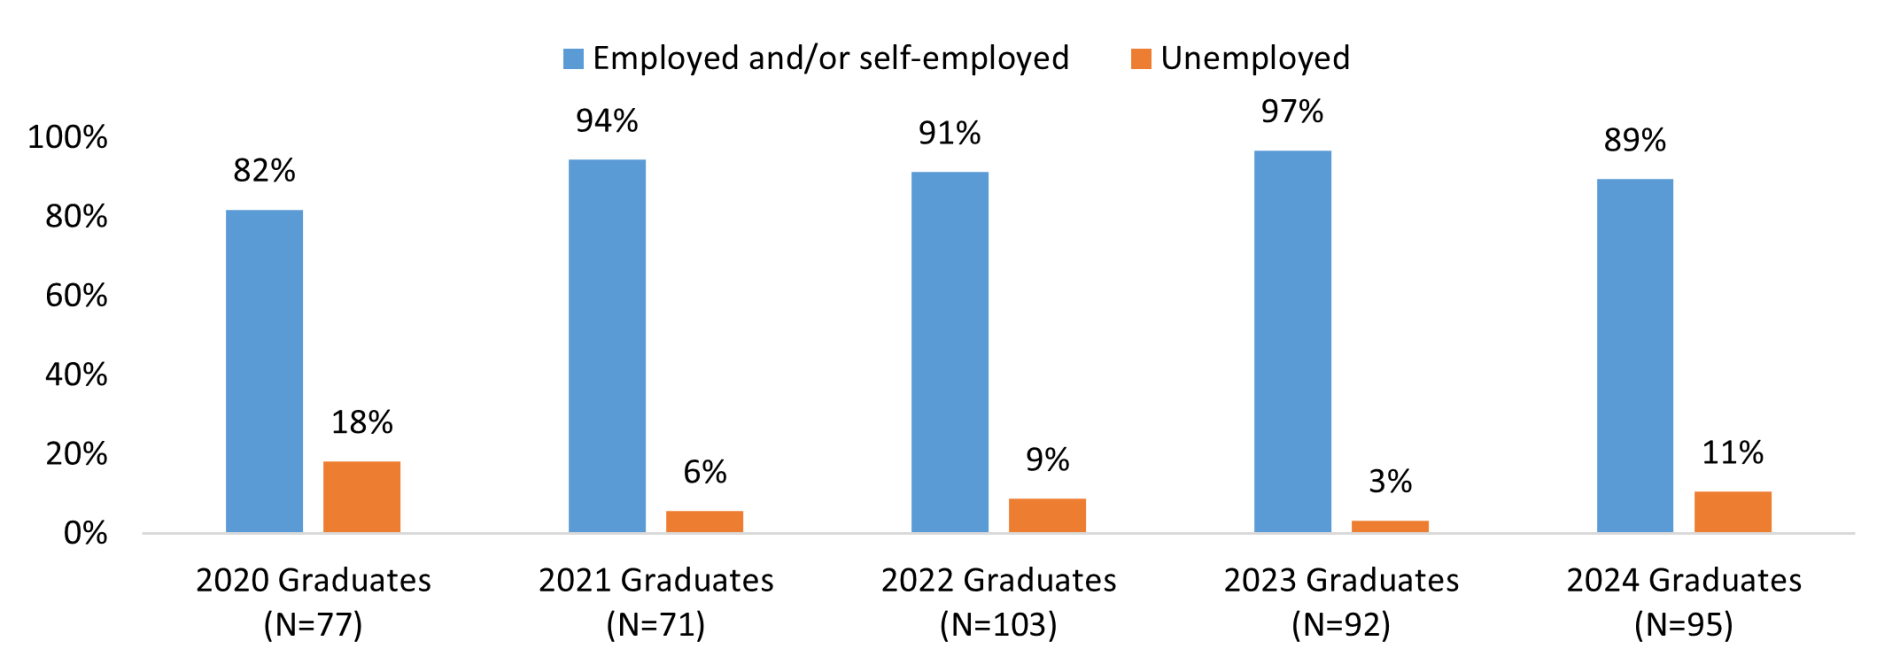
Employment One Year After Graduation – 2020-2024 Graduates
Employment Status of OLC Graduates Including Unknown Status
Employment Status of OLC Graduates With Known Status
Job Location of 2020–2024 Graduates
| On a Reservation | Pine Ridge Reservation | Cheyenne River Reservation | Other Reservation | Off Reservation – Native Org* | Off Reservation | |||||||
|---|---|---|---|---|---|---|---|---|---|---|---|---|
| 2020 Graduates | 46 | 75% | 36 | 59% | 9 | 15% | 1 | 2% | 5 | 8% | 10 | 16% |
| 2021 Graduates | 52 | 78% | 40 | 60% | 10 | 15% | 2 | 3% | 7 | 10% | 8 | 12% |
| 2022 Graduates | 66 | 75% | 54 | 61% | 11 | 13% | 1 | 1% | 11 | 13% | 11 | 13% |
| 2023 Graduates | 67 | 82% | 59 | 72% | 8 | 10% | 0 | 0% | 5 | 9% | 10 | 7% |
| 2024 Graduates | 69 | 84% | 48 | 59% | 20 | 24% | 1 | 1% | 7 | 9% | 6 | 7% |
| 5-Year Average | 79% | 62% | 15% | 1% | 9% | 12% | ||||||
* Organization specifically geared toward Native Americans, e.g., Great Plains Tribal Leaders’ Health Board, NDN Collective, Oglala Sioux Lakota Nursing Home
Percentage based on the number of employed graduates with known job location
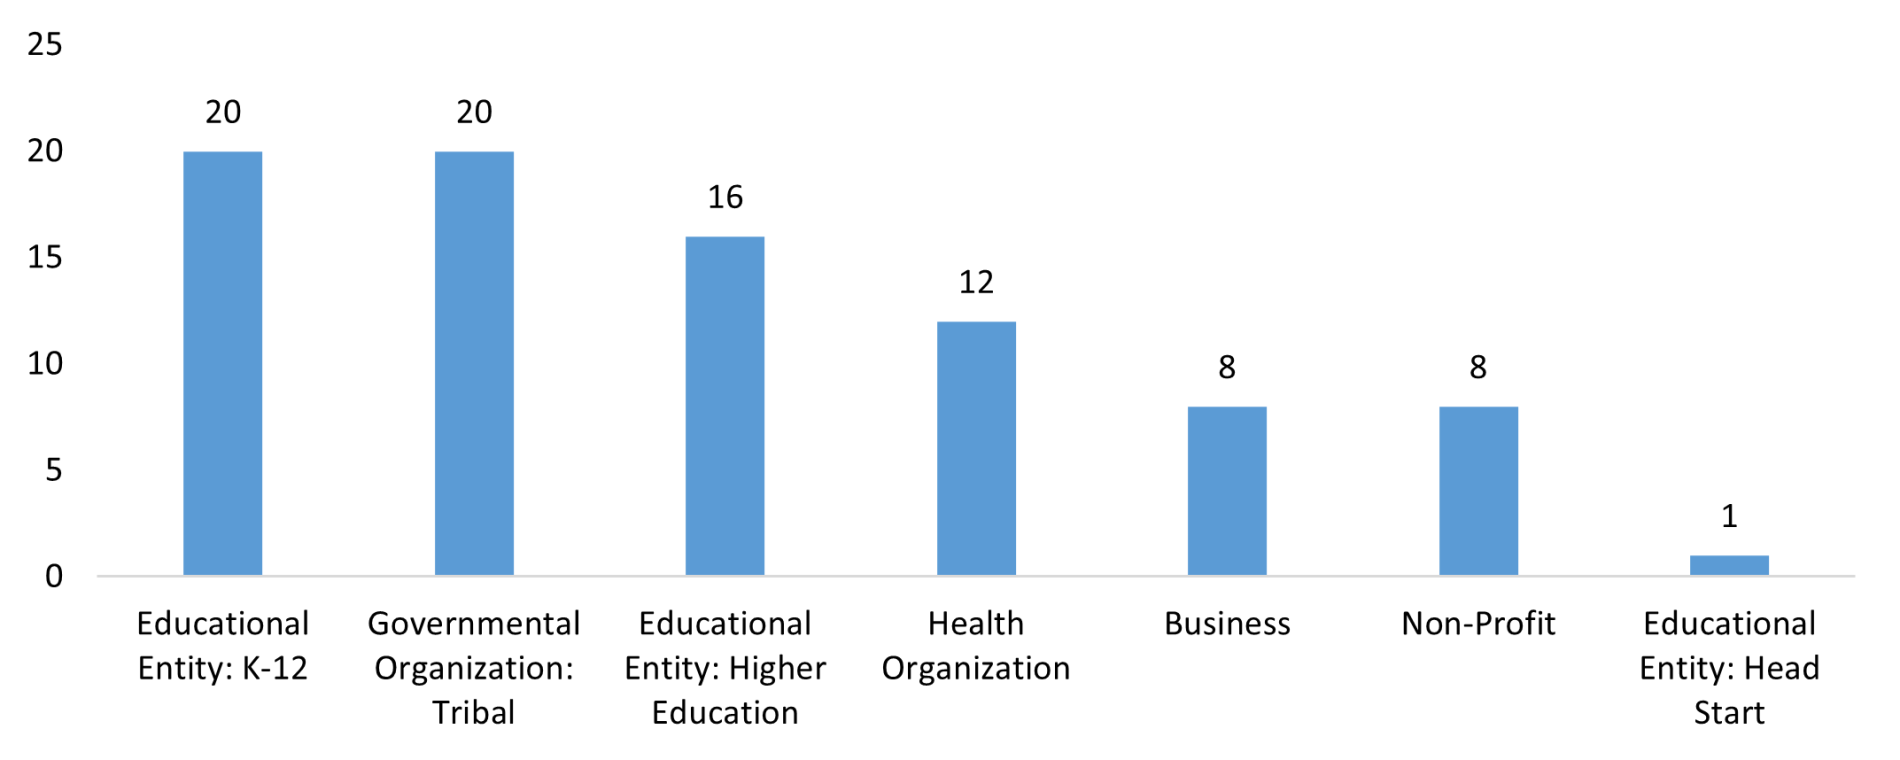
Types of Organizations Employing 2024 OLC Graduates
Graduate School Enrollment of 2024 Bachelor’s Degree Graduates
| # of Graduates | Enrolled at Graduate Level | Graduate Level at OLC | Graduate Level Elsewhere | ||||
|---|---|---|---|---|---|---|---|
| Degree | # | # | % | # | % | # | % |
| B.A. in Early Childhood | 2 | 0 | 0% | N/A | N/A | N/A | N/A |
| B.A. in Lakota Studies – Indian Law | 11 | 1 | 9% | 1 | 100% | 0 | 0% |
| B.A. in Lakota Studies – Lakota Arts | 3 | 1 | 33% | 1 | 100% | 0 | 0% |
| B.A. in Lakota Studies – Lakota Language | 4 | 0 | 0% | N/A | N/A | N/A | N/A |
| B.A. in Leadership and Communications | 3 | 1 | 33% | 0 | 0% | 1 | 100% |
| B.S. in Business Administration – Management | 12 | 1 | 8% | 0 | 0% | 1 | 100% |
| B.S. in Business Administration – Accounting | 2 | 0 | 0% | N/A | N/A | N/A | N/A |
| B.S. in Business Administration – Tribal Management | 2 | 0 | 0% | N/A | N/A | N/A | N/A |
| B.S. in Business Administration – Entrepreneurship | 2 | 1 | 50% | 0 | 0% | 1 | 100% |
| B.S. in Information Technology | 6 | 0 | 0% | N/A | N/A | N/A | N/A |
| B.S. in K-8 Elementary Education | 8 | 3 | 38% | 1 | 33% | 2 | 67% |
| B.S. in Natural Science – Conservation Biology | 3 | 2 | 67% | 0 | 0% | 2 | 100% |
| Bachelor of Social Work | 10 | 4 | 40% | 1 | 25% | 3 | 75% |
| All BA/BS Graduates | 68 | 14 | 21% | 4 | 29% | 10 | 71% |
Sources: National Student Clearinghouse Student Tracker, OLC Registrar’s Office
Bachelor’s Degree Enrollment of 2024 Associate Degree Graduates
| # of AA/AAS Graduates | Enrolled in BA/BS Program | BA/BS Program at OLC | BA/BS Program Elsewhere | ||||
|---|---|---|---|---|---|---|---|
| Department | # | # | % | # | % | # | % |
| A.A. in Early Childhood | 4 | 3 | 75% | 2 | 67% | 1 | 33% |
| A.A. in Elementary Education | 3 | 2 | 67% | 2 | 100% | 0 | 0% |
| A.A. in General Business | 26 | 22 | 85% | 20 | 91% | 2 | 9% |
| A.A. in Graphic Arts | 5 | 2 | 40% | 2 | 100% | 0 | 0% |
| A.A. in Lakota Studies | 22 | 16 | 73% | 15 | 94% | 1 | 6% |
| A.A. in Nursing | 17 | 2 | 12% | 0 | 0% | 2 | 100% |
| A.A. in Tribal Law | 17 | 13 | 76% | 13 | 100% | 0 | 0% |
| A.A.S. in Automotive Technology | 4 | 2 | 50% | 2 | 100% | 0 | 0% |
| A.A.S. in Electrical Technology | 2 | 0 | 0% | N/A | N/A | N/A | N/A |
| A.A.S. in General Construction | 3 | 1 | 33% | 1 | 100% | 0 | 0% |
| A.A.S. in Information Technology | 1 | 1 | 100% | 1 | 100% | 0 | 0% |
| A.A.S. in Office Technology | 2 | 1 | 50% | 1 | 100% | 0 | 0% |
| All AA/AAS Graduates | 106 | 65 | 61% | 59 | 91% | 6 | 9% |
Sources: National Student Clearinghouse Student Tracker, OLC Registrar’s Office
Note: This table is based on an unduplicated count of graduates. Students who earned multiple credentials are only counted for their highest degree, or the first one listed, when multiple degrees at the same level were earned. Two A.A. in General Business and one A.A. in Lakota Studies graduates were awarded their degrees posthumously. These graduates are excluded from the table above.
Licensure Exam Pass Rates
i) National Council Licensure Examination (NCLEX) Pass Rates of OLC AA in Nursing Graduates
| Annual Pass Rate of First-Time Test-Takers | |||||
|---|---|---|---|---|---|
| Year | Pass | Fail | Total FTTT | % Pass | |
| 2015 | 4 | 1 | 5 | 80% | |
| 2016 | 5 | 2 | 7 | 71% | |
| 2017 | 11 | 2 | 13 | 85% | |
| 2018 | 10 | 2 | 12 | 83% | |
| 2019 | 7 | 3 | 10 | 70% | |
| 2020 | 6 | 5 | 11 | 55% | |
| 2021 | 4 | 10 | 14 | 29% | |
| 2022 | 2 | 10 | 12 | 17% | |
| 2023 | 8 | 2 | 10 | 80% | |
| 2024 | 8 | 17 | 9 | 47% | |
Go to Nursing_NCLEX For additional OLC Nursing NCLEX data.
ii) Teacher Certification Praxis Pass Rates of OLC Education Graduates
Title II Report 2023-2024 Academic Year
| Group | Number Taking Assessment | Number Passing Assessment | Institutional Pass Rate |
|---|---|---|---|
| All program completers, 2023-24 | 8 | Number of graduates passing and the pass rate is not reported due to fewer than ten test-takers | |
| All program completers, 2022-23 | 4 | ||
| All program completers, 2021-22 | 2 | ||
| All program completers, combined 2021/22-2023/24 | 14 | 14 | 100% |
Note: In cases where there are less than ten students taking the assessment or license/certificate, the number passing and pass rate are not reported. When two or more completer groups have fewer than ten completers, data is combined across the three completer years into an additional completer group for the Summary pass rates.
Go to Education_Praxis for additional OLC Education Praxis data.